DISCRETE FOURIER TRANSFORMATION(DFT)
In this post we are gonna learn about fourier transformation and implementation of Discrete fourier transformation in python.

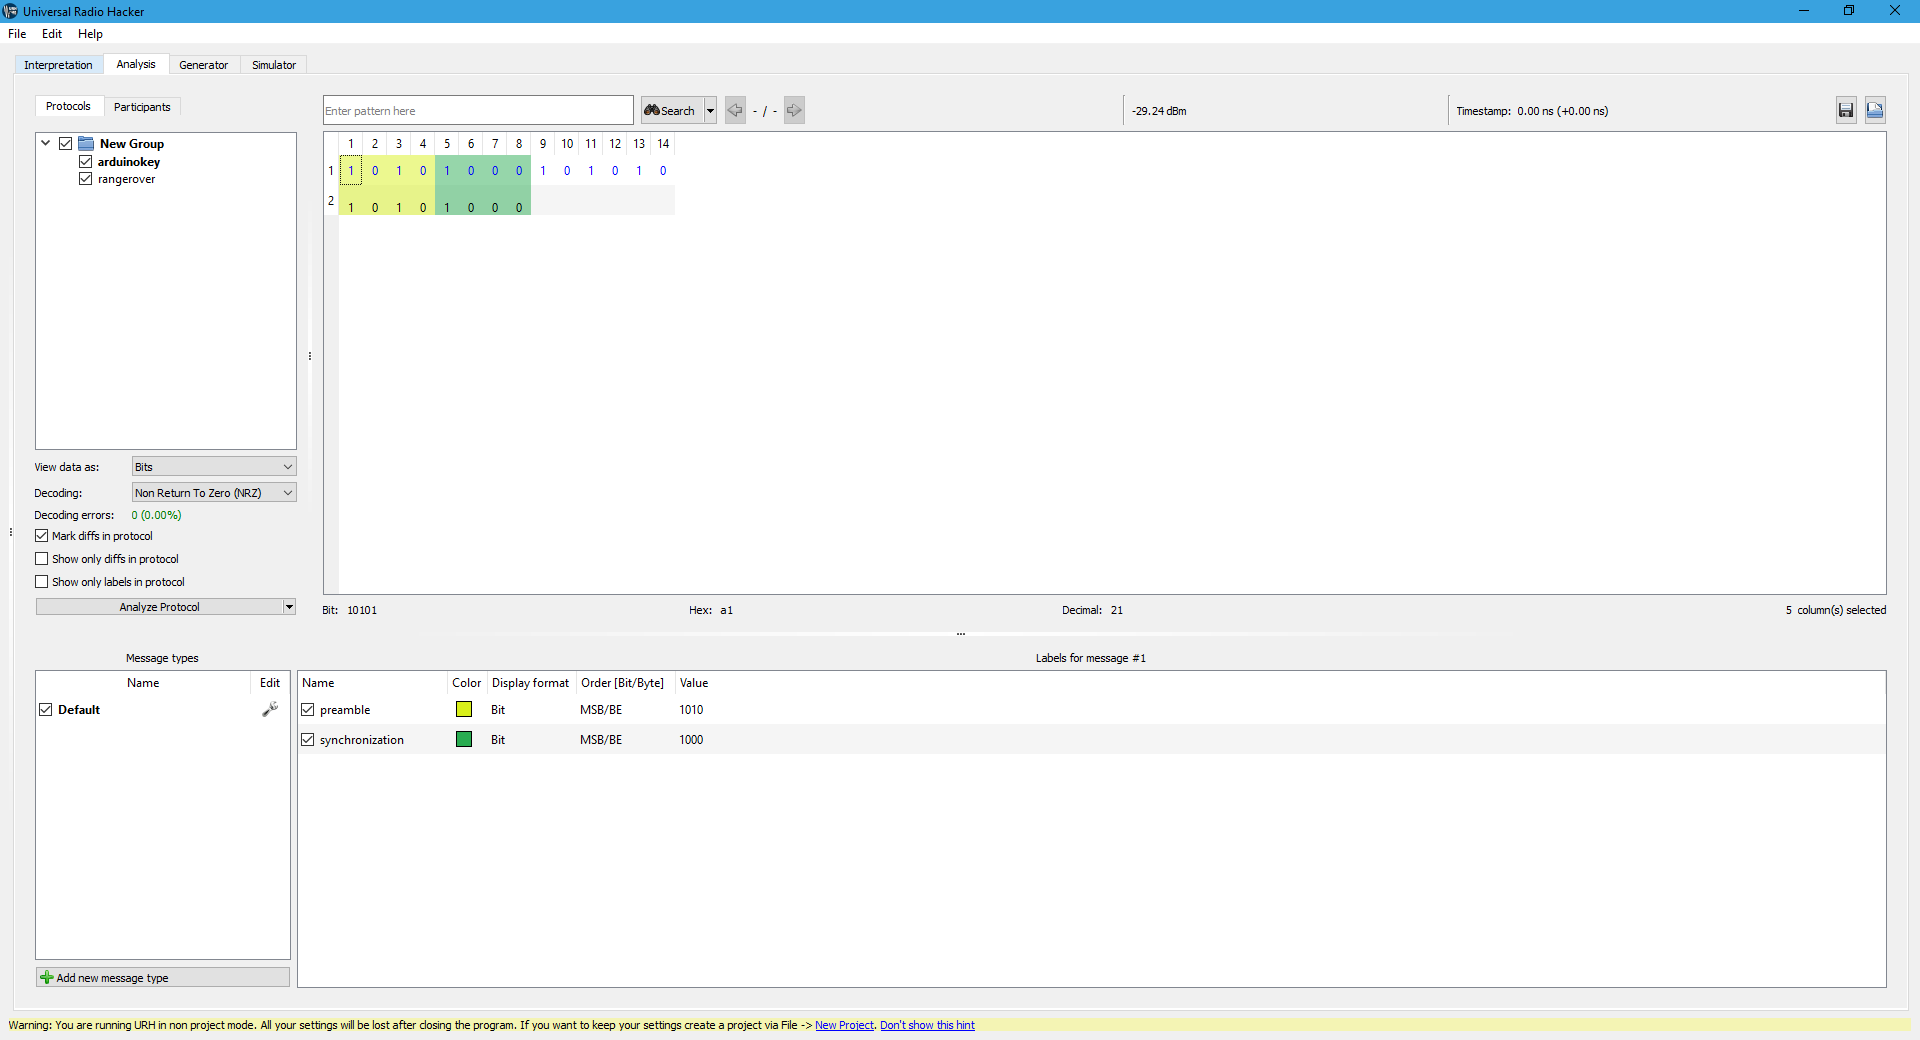
It is applied to specifically discete signals. It is used to break the unperiodic wave into bunch of sinusoids and cosine waves for analysis. Using DFT we can split a wave like above picture into bunch of sinusoids spectrum like this.

DFT is defined as
.png)
where
N = no.of samples
 n = current sample
K = current sampling frequencyxn = the sine value at sample
xn = The sine value at sample n
Xk = The DFT in which the real and imaginary values a wave with Amplitude and phase info
In here the nature of equation is Xo = Σxn , tells us If N in ODD then, X1,X2...X(N-1)/2 contains the positive frequency and X(N+1)/2.....XN-1 in negative frequency in decreaing order. If N in EVEN then, X1,X2,...,XN/2-1 contains positive frequency and the elements XN/2.. .XN-1 in negative decreasing order.
The Xk gives the both real and imaginary numbers so to get amplitude and phase we need this formula.

.png)
Here is the code for DFT python function creating a 1Hz and 4Hz , 7Hz waves addition and DFT :
import numpy as np

plt.style.use('seaborn-poster')
#matplotlib inline

# sampling rate
sr = 100
# sampling interval
ts = 1.0/sr
t = np.arange(0,1,ts)

freq = 1
x = 3*np.cos(2*np.pi*freq*t)

freq = 4
x += np.sin(2*np.pi*freq*t)

freq = 7
x += 0.5* np.sin(2*np.pi*freq*t)

plt.figure(figsize = (8, 6))
plt.plot(t, x, 'r')
plt.ylabel('Amplitude')

plt.show()


def DFT(x):
    """
    Function to calculate the
    discrete Fourier Transform
    of a 1D real-valued signal x
    """

    N = len(x)
    n = np.arange(N)
    k = n.reshape((N, 1))
    e = np.exp(-2j * np.pi * k * n / N)

    X = np.dot(e, x)

    return X

X = DFT(x)

# calculate the frequency
N = len(X)
n = np.arange(N)
T = N/sr
freq = n/T

plt.figure(figsize = (8, 6))
plt.stem(freq, abs(X), 'b', \
         markerfmt=" ", basefmt="-b")
plt.xlabel('Freq (Hz)')
plt.ylabel('DFT Amplitude |X(freq)|')
plt.show()

n_oneside = N//2
# get the one side frequency
f_oneside = freq[:n_oneside]

# normalize the amplitude
X_oneside =X[:n_oneside]/n_oneside

plt.figure(figsize = (12, 6))
plt.subplot(121)
plt.stem(f_oneside, abs(X_oneside), 'b', \
         markerfmt=" ", basefmt="-b")
plt.xlabel('Freq (Hz)')
plt.ylabel('DFT Amplitude |X(freq)|')

plt.subplot(122)
plt.stem(f_oneside, abs(X_oneside), 'b', \
         markerfmt=" ", basefmt="-b")
plt.xlabel('Freq (Hz)')
plt.xlim(0, 10)
plt.tight_layout()
plt.show()

Comments
Post a Comment